PC Students Complete the Data Visualization Bootcamp
In today’s data-driven world, the ability to present data and analyze trends is of significant importance to companies large and small. Over the past week, the PCSB offered the chance for PC of all majors to explore art and science of data visualization through the Data Visualization Bootcamp.

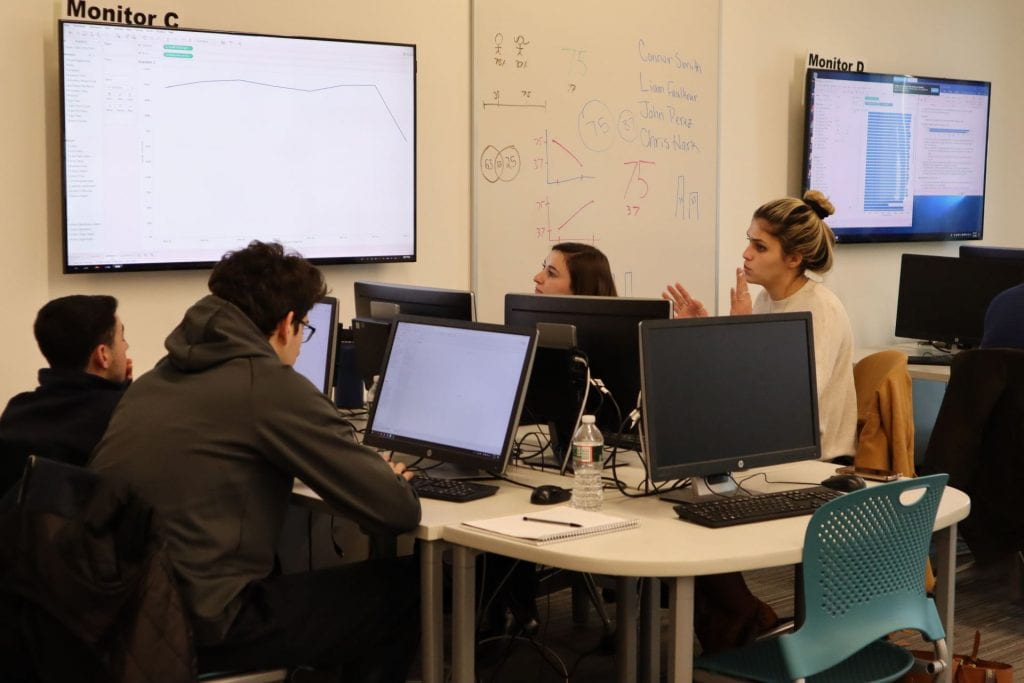
This opportunity allowed participating students to leverage Tableau, as well as other visualization tools, to enhance data presentation skills and communicate evidence in a compelling manner. Students worked with large data sets, such as the U.S. domestic flight data from 2010-2011, and used Tableau to dig into the data and analyze trends in flight patterns, departure and arrival delays, and other industry phenomena. Students then determined which pieces of data were useful in understanding trends and how to create visuals that might tell the story and relay important information in a presentation.
According to Dr. Dan Horne, Associate Dean and program director, the Data Visualization Bootcamp “serves as an experiential starting point for those looking to pursue careers in data analytics and enhance their data presentation skills.” The three day program concluded with student presentations on their findings.
Offered at the end of winter break each year, students are able to return to campus early to pursue this supplemental learning opportunity which is not graded, but does appear on a student’s transcript. Similarly, the next level course, the Data Analytics Bootcamp, is offered each year in August, just before the start of the fall semester. Learn more at https://business.providence.edu/initiatives/data-analytics-visualization/.


